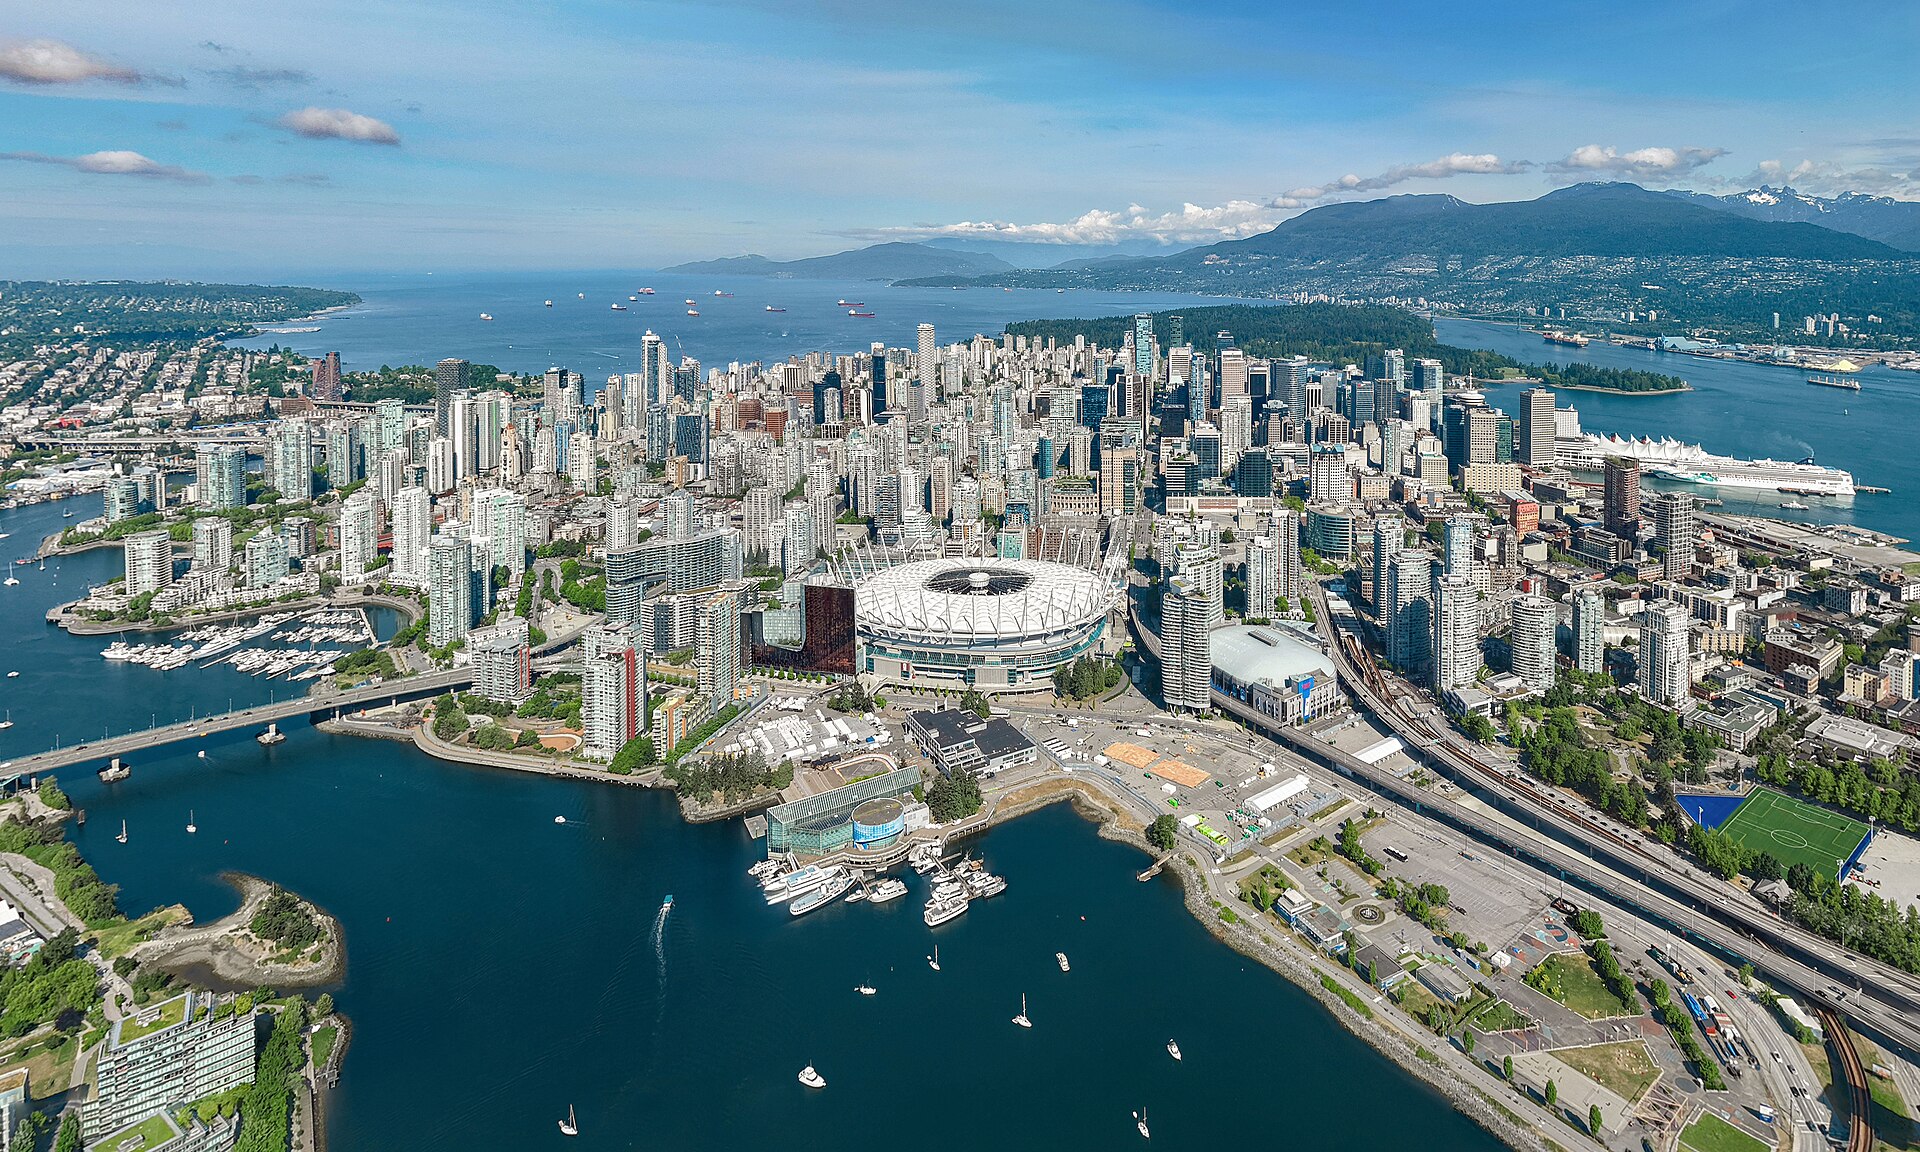
Understand Vancouver before you commit to an address
Vancouver is 22 official local areas pressed between the mountains and the Fraser, and which side of Ontario Street you land on shapes the price, the school catchment and the commute more than the home does. This is a guide to the city one community at a time — 22 local areas — with the arithmetic of buying here worked out alongside it.

What it actually costs to live here
Two calculators built on British Columbia's own rules rather than a generic template: Canadian semi-annual compounding, the real minimum down payment tiers, and the closing costs this province charges rather than the ones it doesn't.
Rent or buy in Vancouver
Whether buying beats renting in Canada's most expensive market, and the year it turns over. Both households start with the same cash and whichever of them has the cheaper month invests the difference, so the comparison is not rigged in either direction.
Mortgage calculator
Semi-annual compounding, every payment frequency including the accelerated ones, BC's property transfer tax with its first-time-buyer exemption, and what an extra payment takes off the end of the loan.
Then find the part of the city you want to be in
The community index groups Vancouver by side of the city. Every guide keeps sourced facts apart from editorial observation, credits its photographs, and dates what it claims.
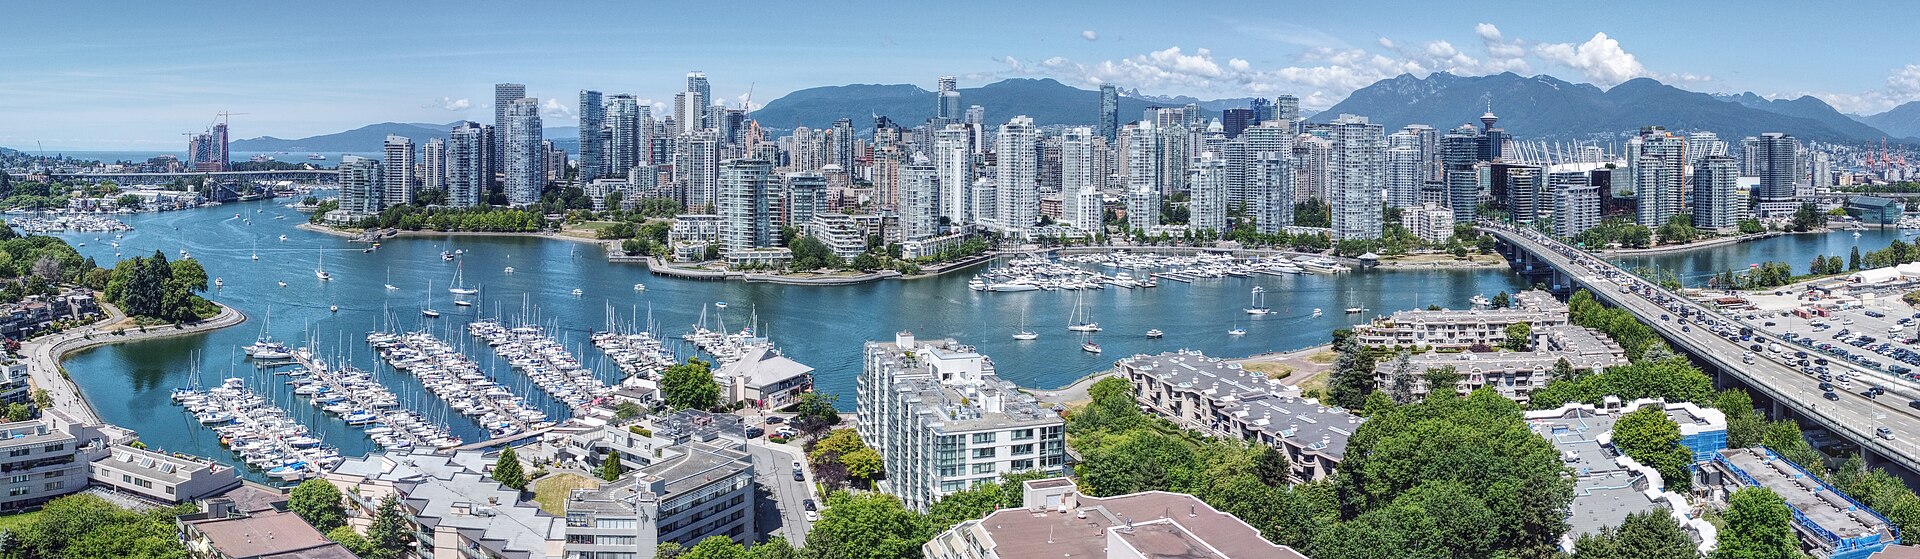
All 22 local areas
Filterable by side of the city, each with sourced facts, schools, parks, amenities, drive times and an honest account of the trade-offs.
Browse every local area →
Downtown, West Side, East Side, South Vancouver
The four sides of the city read differently on price, housing stock and commute. Start with the side that matches your budget and work inward.
Compare the four sides →Sourced, dated, and separated from the guesswork
The calculators open with real Vancouver figures — the benchmark price, market rents, the property tax rate this city actually levies — each one cited and stamped with the period it describes. Every one of them is an editable input, because a figure that describes the whole city rarely describes your purchase.
Forward-looking rates are a different kind of number. Appreciation, rent inflation and investment returns are assumptions, not facts, and they are labelled that way wherever they appear. Read the research and sourcing methodology for how the line is drawn.
- Benchmark price and market rents: published statistics, dated to the month.
- Property tax, transfer costs and insurance premiums: the municipal and provincial schedules.
- Appreciation, rent growth and investment returns: assumptions you should change.
- Nothing here is a lender quote, a pre-approval or financial advice.